TeslaHubs
Scale a Tesla accessories store across two accounts while the return holds.
8.6×Attributed revenue per month · Jan 2026 to Oct 2026, against the 10 months before the engagement
TeslaHubs became a Google Ads client in April 2025. This record follows spend, attributed revenue and campaign mix across two accounts, from the ten months before we started through October 2026.
8.6×TeslaHubs
Talk about an account like thisGoogle Ads since April 2025, month by month.
TeslaHubs became a client on April 5, 2025. Two Google Ads accounts are reported together in US dollars, and the ten months on record before that date are the baseline.
Then, beside now.
Averages over two windows of the same length: the 10 months before the engagement, and the latest 10 complete months. Each row's bars share that row's scale.
Jun 2024 to Mar 2025Jan 2026 to Oct 2026
| Measure | Jun 2024 to Mar 2025 | Jan 2026 to Oct 2026 | On one scale | Change |
|---|---|---|---|---|
| Attributed revenue per month | $15,846 | $136,056 | 8.6× | |
| Ad spend per month | $4,572 | $31,671 | 6.9× | |
| Attributed revenue / ad spend | 3.47× | 4.30× | +24% | |
| Conversions per month | 138 | 1,150 | 8.3× | |
| Campaigns with spend, monthly average | 7 | 54 | 7.2× |
USD · monthly averages. Bars compare the two windows within a row only; rows use different units.
Every month of the record.
Attributed revenue as columns and ad spend as the line, on one USD scale. Columns before Apr 2025 are muted: they are the account before Tegra managed it. Hover, tap or use the arrow keys to read a month.
0–200,000 · USD per month · common zero baseline. Gaps are unknown. Event pins mark timing, not causation.
- First month above $15,000 in spendJun 2025
- A second Google Ads account starts spendingDec 2025
- Shopping and Demand Gen added beside Performance Max and SearchJul 2026
Read the values
| Period | Attributed revenue | Ad spend |
|---|---|---|
| Jun 2024 | $4,338 | $1,281 |
| Jul 2024 | $12,663 | $3,333 |
| Aug 2024 | $7,844 | $3,308 |
| Sep 2024 | $12,385 | $3,913 |
| Oct 2024 | $15,374 | $4,650 |
| Nov 2024 | $24,307 | $6,256 |
| Dec 2024 | $23,509 | $5,824 |
| Jan 2025 | $20,626 | $5,484 |
| Feb 2025 | $17,627 | $4,929 |
| Mar 2025 | $19,785 | $6,743 |
| Apr 2025 | $20,094 | $6,452 |
| May 2025 | $28,167 | $9,086 |
| Jun 2025 | $50,601 | $17,054 |
| Jul 2025 | $32,993 | $10,384 |
| Aug 2025 | $35,461 | $11,353 |
| Sep 2025 | $32,393 | $9,652 |
| Oct 2025 | $49,228 | $12,406 |
| Nov 2025 | $66,630 | $15,710 |
| Dec 2025 | $106,431 | $29,236 |
| Jan 2026 | $92,958 | $25,169 |
| Feb 2026 | $42,217 | $11,324 |
| Mar 2026 | $84,701 | $20,359 |
| Apr 2026 | $139,069 | $31,233 |
| May 2026 | $160,667 | $37,450 |
| Jun 2026 | $179,260 | $39,586 |
| Jul 2026 | $178,075 | $41,139 |
| Aug 2026 | $157,150 | $33,910 |
| Sep 2026 | $151,147 | $33,867 |
| Oct 2026 | $175,313 | $42,675 |
Source: Google Ads API campaign report, read November 10, 2026. Engagement dates from Tegra's client records. Period totals only.
What was scaled.
Monthly ad spend by campaign type. Every panel uses the same 0 to 40K scale, so a taller panel is a larger budget.
Performance Max
$25,156a month, Jan 2026 to Oct 2026 · 79% of spend
Jun 2024First spend Jul 2024Oct 2026
Shopping
$672a month, Jan 2026 to Oct 2026 · 2% of spend
Jun 2024First spend Apr 2025Oct 2026
Search
$4,968a month, Jan 2026 to Oct 2026 · 16% of spend
Jun 2024Spending from the first monthOct 2026
Demand Gen, video and display
$875a month, Jan 2026 to Oct 2026 · 3% of spend
Jun 2024First spend Sep 2024Oct 2026
USD · common 0–40K scale · the rule marks Apr 2025, the first managed month; earlier bars are muted.
Read the values
| Year | Performance Max | Shopping | Search | Demand Gen, video and display |
|---|---|---|---|---|
| 2024 | $20,882 | $0 | $6,984 | $698 |
| 2025 | $116,877 | $443 | $20,909 | $259 |
| 2026 | $251,559 | $6,724 | $49,682 | $8,748 |
Year by year.
Ad spend, attributed revenue and the return between them for each calendar year in the record. Part-years are marked; the bar compares attributed revenue per month, which a part-year does not distort.
| Period | Ad spend | Attributed revenue | Attributed revenue per month | Return |
|---|---|---|---|---|
| 2024 · Jun to DecBefore the engagement | $28,565 | $100,419 | $14,346 | 3.52× |
| 2025 · Jan to MarBefore the engagement | $17,156 | $58,038 | $19,346 | 3.38× |
| 2025 · Apr to Dec | $121,332 | $421,997 | $46,889 | 3.48× |
| 2026 · Jan to Oct | $316,712 | $1,360,558 | $136,056 | 4.30× |
USD · period totals, with a per-month average on a common 0–$136,056 scale.
How to read this record
Google Ads campaign reporting in the account currency, on conversion-date attribution: each conversion is counted in the period it happened. Attributed revenue is platform-attributed conversion value before cost of goods, fees and shipping. Campaigns with spend counts the distinct campaigns that spent in a month.
- Platform-attributed conversion value, not audited sales, profit or incremental lift. Other channels can claim the same orders.
- A before-and-after comparison is an observation, not a controlled test. Prices, products, seasonality and the brand's other marketing changed across these periods.
- The months before the engagement were managed by others. They show the starting point and are not a judgment of that work.
- Two accounts in one currency are added together. A buyer who clicked ads from both accounts can be credited in each.
- The baseline is the ten months before April 2025; the comparison window is the latest ten complete months, which are different calendar months.
Source: Google Ads API campaign report, read November 10, 2026. Engagement dates from Tegra's client records. Period totals only.
What we did.
The main pieces of work on this account.
Rebuild the caliper-cover route
Recorded September 27, 2026: the caliper-cover campaign and its four presell pages were rebuilt. A fit-first buy-box test was registered on October 5 with a fixed decision rule.
Take a proven lane to new markets
Recorded September 17, 2026: the ProGuard feed lane was cloned for Canada, the United Kingdom and Australia, 68 rows each, priced in local currency.
Test pages under a registered rule
Recorded October 5, 2026: a ranked comparison page launched against the existing CarPlay adapter page as a two-arm test. At the November 9 read both arms were still below the evidence floor.
TeslaHubs: see the work
Open any piece at full size. Offers shown are the originals from the time. We do not credit an account’s results to any single design.
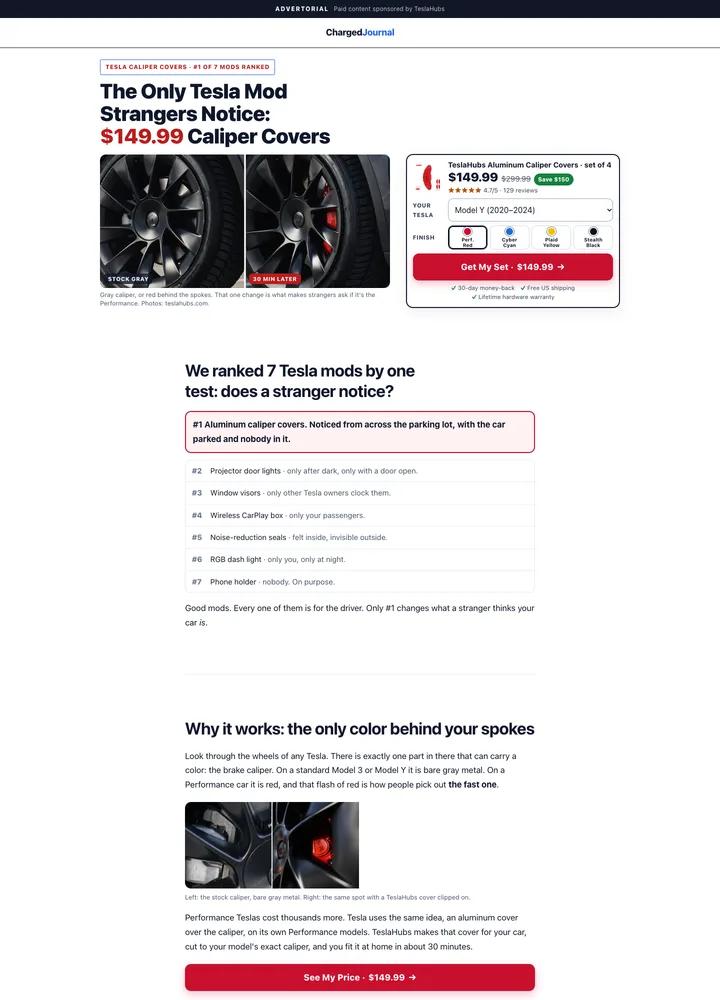 Opening shown
01 / 04
TeslaHubs · A ranked list with one clear pick
Seven Tesla mods are ranked by a single test, and the page builds toward the one a stranger notices. Product, fitment and price sit beside the argument.

Source: Tegra local page build · November 10, 2026
How the work fits together.
- Product pockets
A wide accessories catalog is grouped into product lines, each with its own feed segment, campaign and destination.
- Feed + campaign
Performance Max and Search carry each line. Shopping and Demand Gen were added in July 2026.
- Page tests
Offer and comparison pages are tested under a decision rule written before the first read.
- Monthly record
Spend, attributed revenue and the campaign mix are read together, across both accounts.
Review the results before the next round of work.
Scale did not cost return here. The latest ten months ran at a higher revenue-to-spend ratio than the ten months before we started, on roughly seven times the spend.
How this was measured.
Google Ads API campaign report for two accounts, read November 10, 2026, with dated entries from Tegra’s work ledger. Period totals only.
| Question | Source scope |
|---|---|
Which period? | June 2024–October 2026 · client since April 5, 2025 |
What is measured? | Google Ads campaign reporting on conversion-date attribution, two accounts combined in USD. Revenue is platform-attributed conversion value, before cost of goods. |
What kind of record? | Performance report |
What engagement? | Managed account |
Sources and limits
- Platform-attributed conversion value before cost of goods, fees and shipping. It is not profit or incremental lift.
- Two Google Ads accounts are added together in USD. A buyer who clicked ads from both can be credited in each.
- The months before April 2025 were managed by others and are shown as the starting point only.
- Page tests named here record launch and method. No test winner is claimed.
Want this kind of work
on your account?
Have our team run it for you, or license the system and run it in-house.