The brief.
Lymphora’s two Klaviyo accounts had been open since December 2025 and campaigns had barely started. Finland had sent one in 90 days, to 64 people.
Our approach.
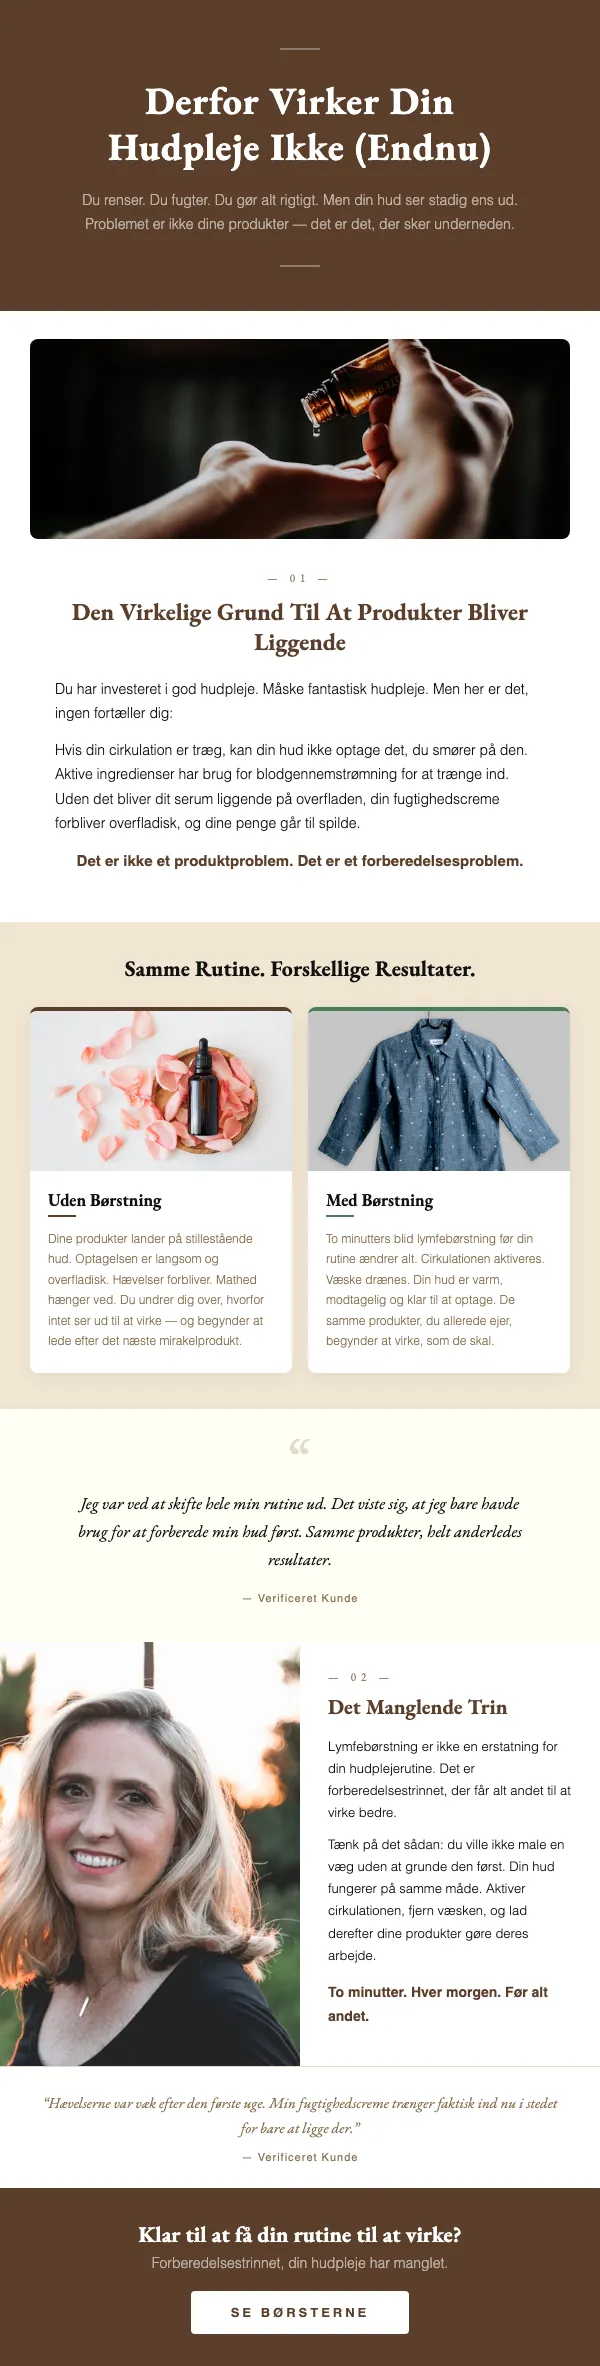
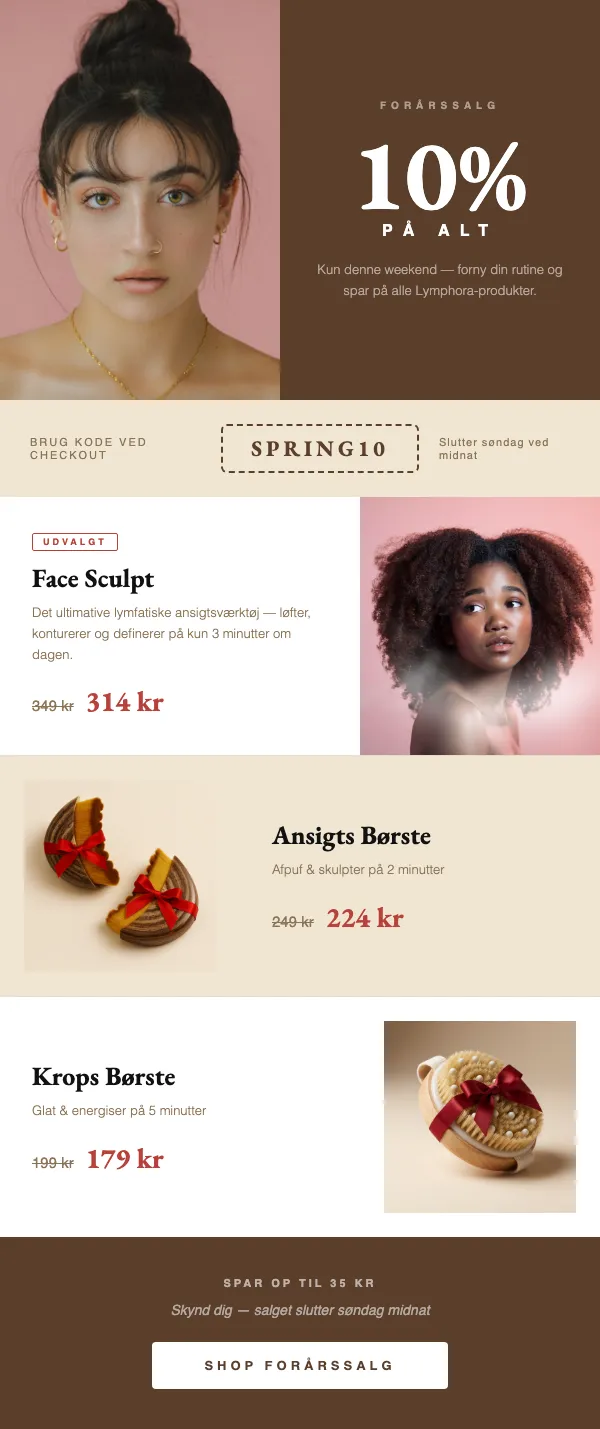
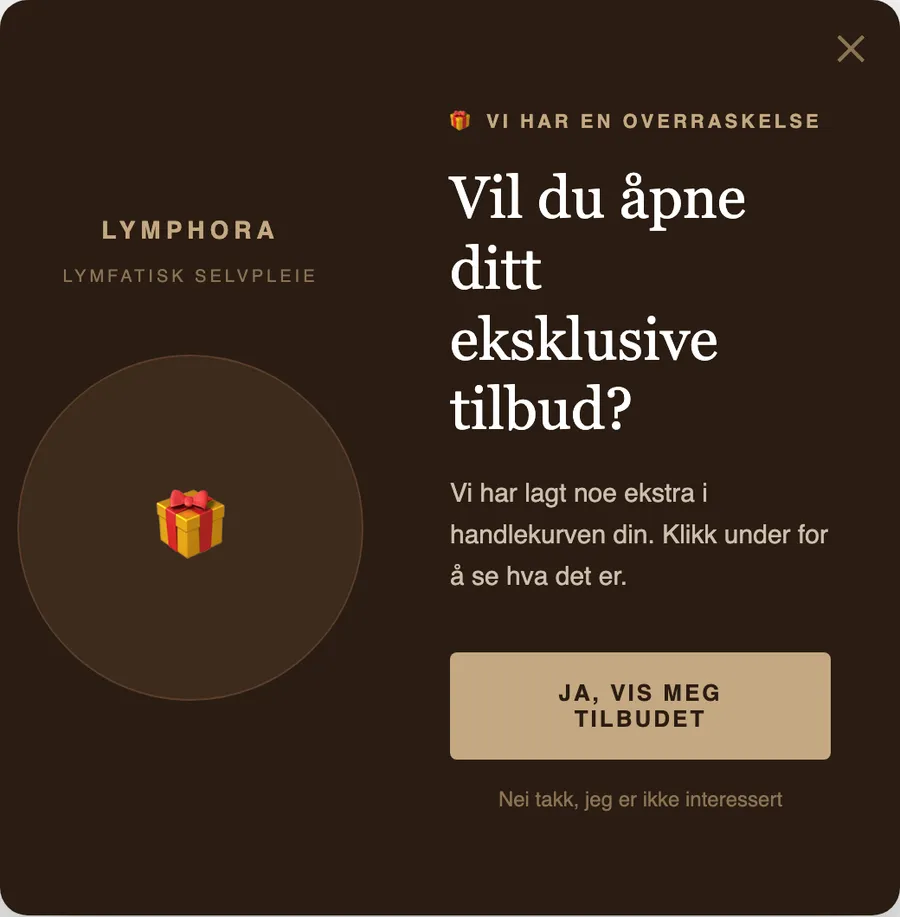
We started a campaign calendar in each language, moved sends to engaged subscribers and rebuilt the abandonment flows.
A closer look at the work.
Finland’s campaign revenue went from nothing to €10,432 in March 2026. Email’s share of store revenue rose from 16.5% to 22.0% in Denmark and from 18.0% to 25.7% in Finland between February and March, and unsubscribe rates fell in both.
Reported outcomeNovember 2025–April 2026
Finland: campaigns before and after the calendar started
Campaigns sent, recipients and campaign revenue in the Finnish account.
Finland: campaigns before and after the calendar started · November 2025–April 2026| Period | Campaigns | Recipients | Campaign revenue |
|---|
90 days before the engagement | 1 | 64 | €0 |
|---|
February 2026 | 7 | 94,879 | €5,338 |
|---|
March 2026 | 9 | 194,561 | €10,432 |
|---|
April 2026 | 8 | 165,987 | €5,105 |
|---|
Source: Account audit, February 2026, and monthly reports for March and April 2026
April fell back after Easter. March reached about twice as many recipients as February.
Reported outcomeFebruary–April 2026
Denmark: campaigns by month
Campaign sends, reach, revenue and click rate for the Danish store.
Denmark: campaigns by month · February–April 2026| Month | Campaigns | Recipients | Campaign revenue | Click rate |
|---|
February 2026 | 10 | 100,581 | 35,170 DKK | 0.83% |
|---|
March 2026 | 9 | 126,728 | 46,260 DKK | 1.19% |
|---|
April 2026 | 8 | 106,916 | 29,679 DKK | 1.12% |
|---|
Source: Monthly reports for the Danish account, March and April 2026
February includes three sends from before our calendar began on February 6. April fell back after Easter.
Reported outcomeFebruary–April 2026
Email’s share of store revenue
Email revenue as a share of each store’s total revenue.
Email’s share of store revenue · February–April 2026| Market | February | March | April |
|---|
Denmark | 16.5% | 22.0% | 18.3% |
|---|
Finland | 18.0% | 25.7% | 23.3% |
|---|
Source: April 2026 account analysis
Klaviyo attribution against Shopify store revenue. April held above February in both markets through a slower month for the stores.
Reported outcomeFebruary–April 2026
Unsubscribe rates fell every month
Campaign unsubscribe rate after sends moved to engaged subscribers.
Unsubscribe rates fell every month · February–April 2026| Market | February | March | April |
|---|
Denmark | 1.54% | 1.21% | 1.10% |
|---|
Finland · 94,879 / 194,561 / 165,987 recipients | 1.31% | 0.84% | 0.69% |
|---|
Source: Monthly reports for March and April 2026
Monthly campaign totals. Denmark’s recipient counts are in the monthly reports and are not restated here.
Reported outcomeFebruary–April 2026
Abandoned checkout, month by month
The flow was cut from four emails to three in mid-February. Revenue and orders for the months around it.
Abandoned checkout, month by month · February–April 2026| Market | February | March | April |
|---|
Denmark | 8,892 DKK | 28,119 DKK · 104 orders from 3,179 recipients | 16,747 DKK · 65 orders from 1,911 recipients |
|---|
Finland | €1,427 · 49 orders | €5,200 · 169 orders from 4,467 recipients | €2,290 · 72 orders from 1,914 recipients |
|---|
Source: March and April 2026 monthly reports
March also had more people starting a checkout, and April fell back with the stores. In Denmark the share of recipients who ordered held at 3.3% in March and 3.4% in April.
Reported outcomeFebruary–April 2026
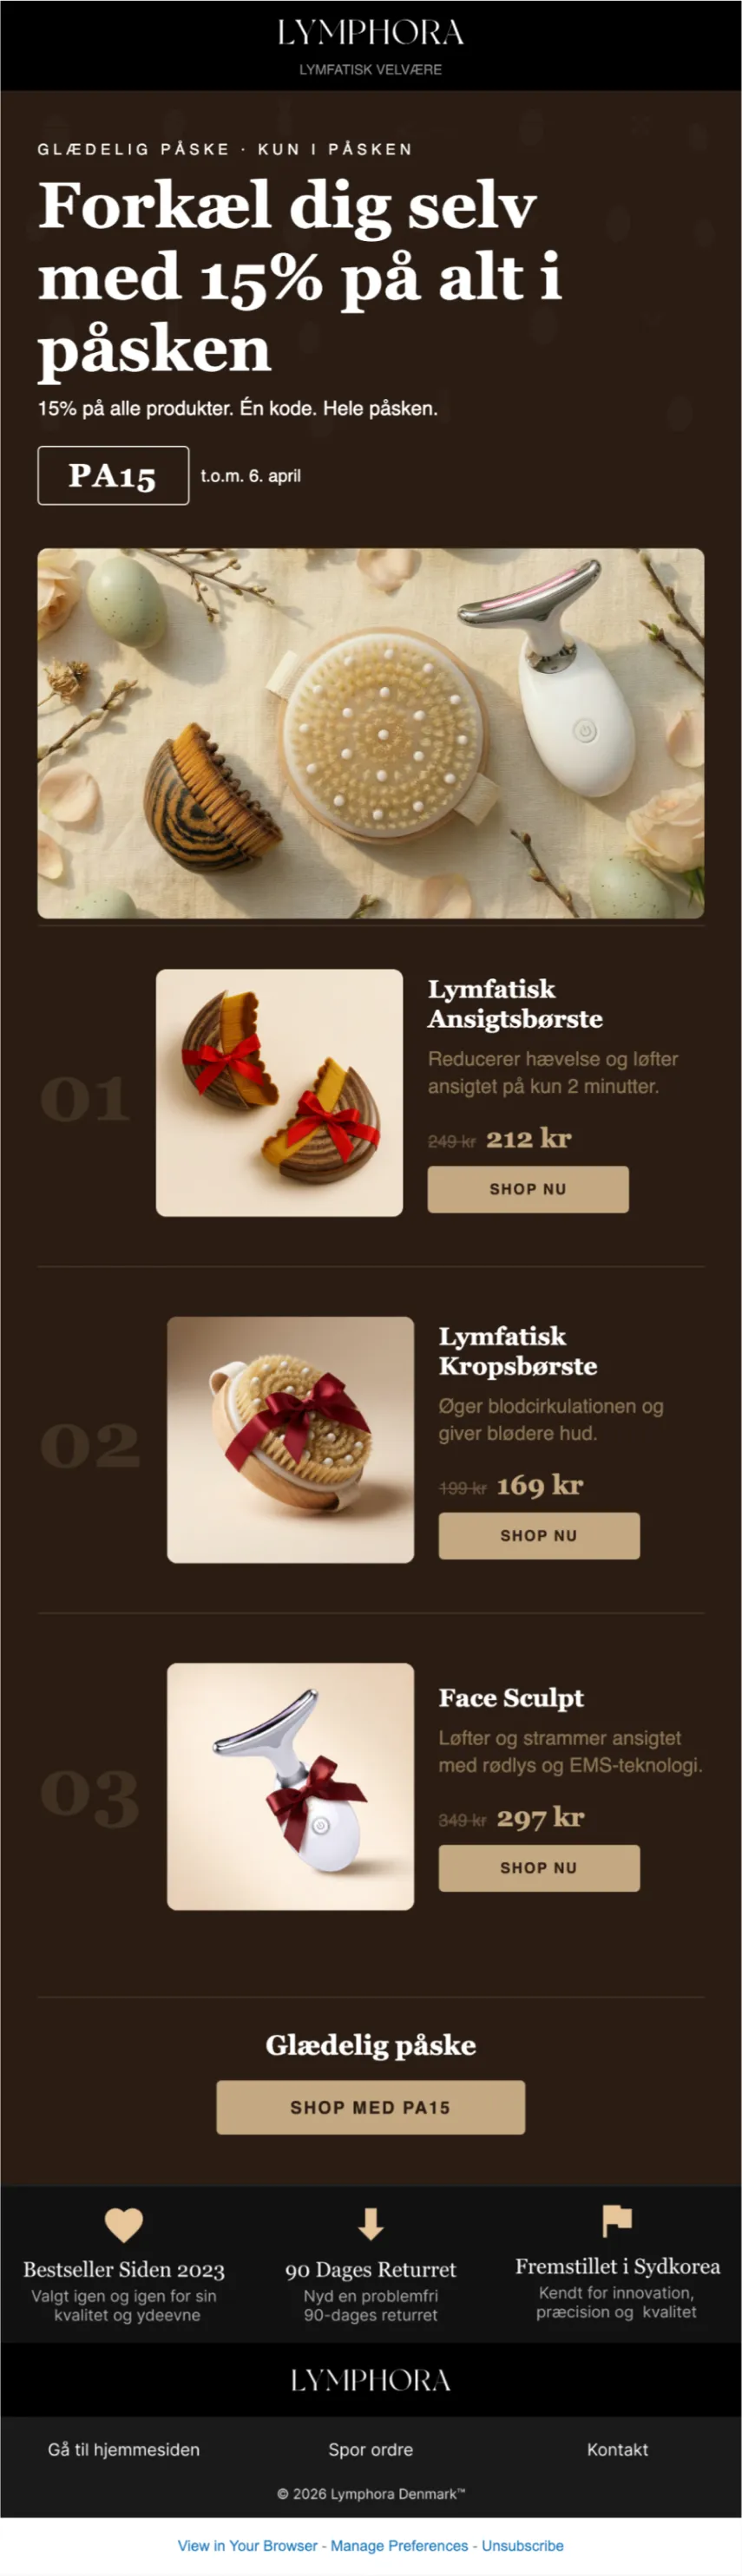
The campaigns that did best
Four single sends by revenue, and the one that was read most.
The campaigns that did best · February–April 2026| Campaign | Result | Recipients |
|---|
Easter sale · Denmark · March 27 | 7,538 DKK · 26 orders | 11,621 |
|---|
Spring flash sale · Denmark · March 6 | 6,940 DKK · 25 orders | 16,787 |
|---|
Easter sale · Finland · March 27 | €1,744 · 57 orders | 19,617 |
|---|
Face Day basics · Finland · March 20 | €1,508 · 44 orders · 2.24% clicked | 26,087 |
|---|
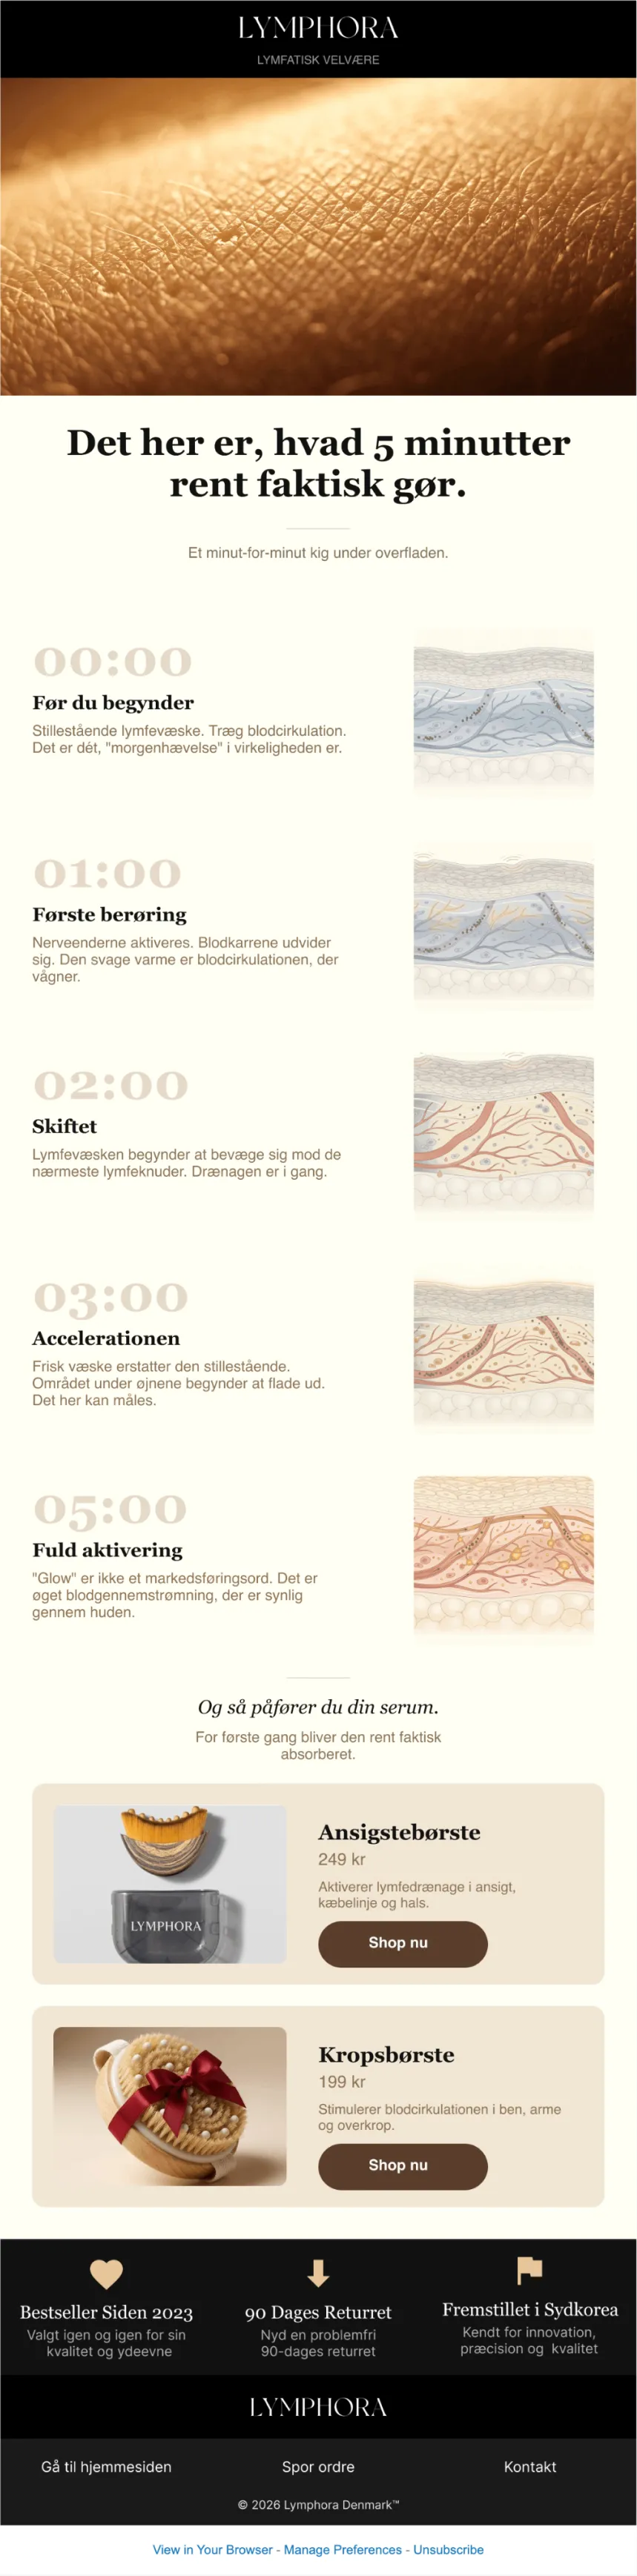
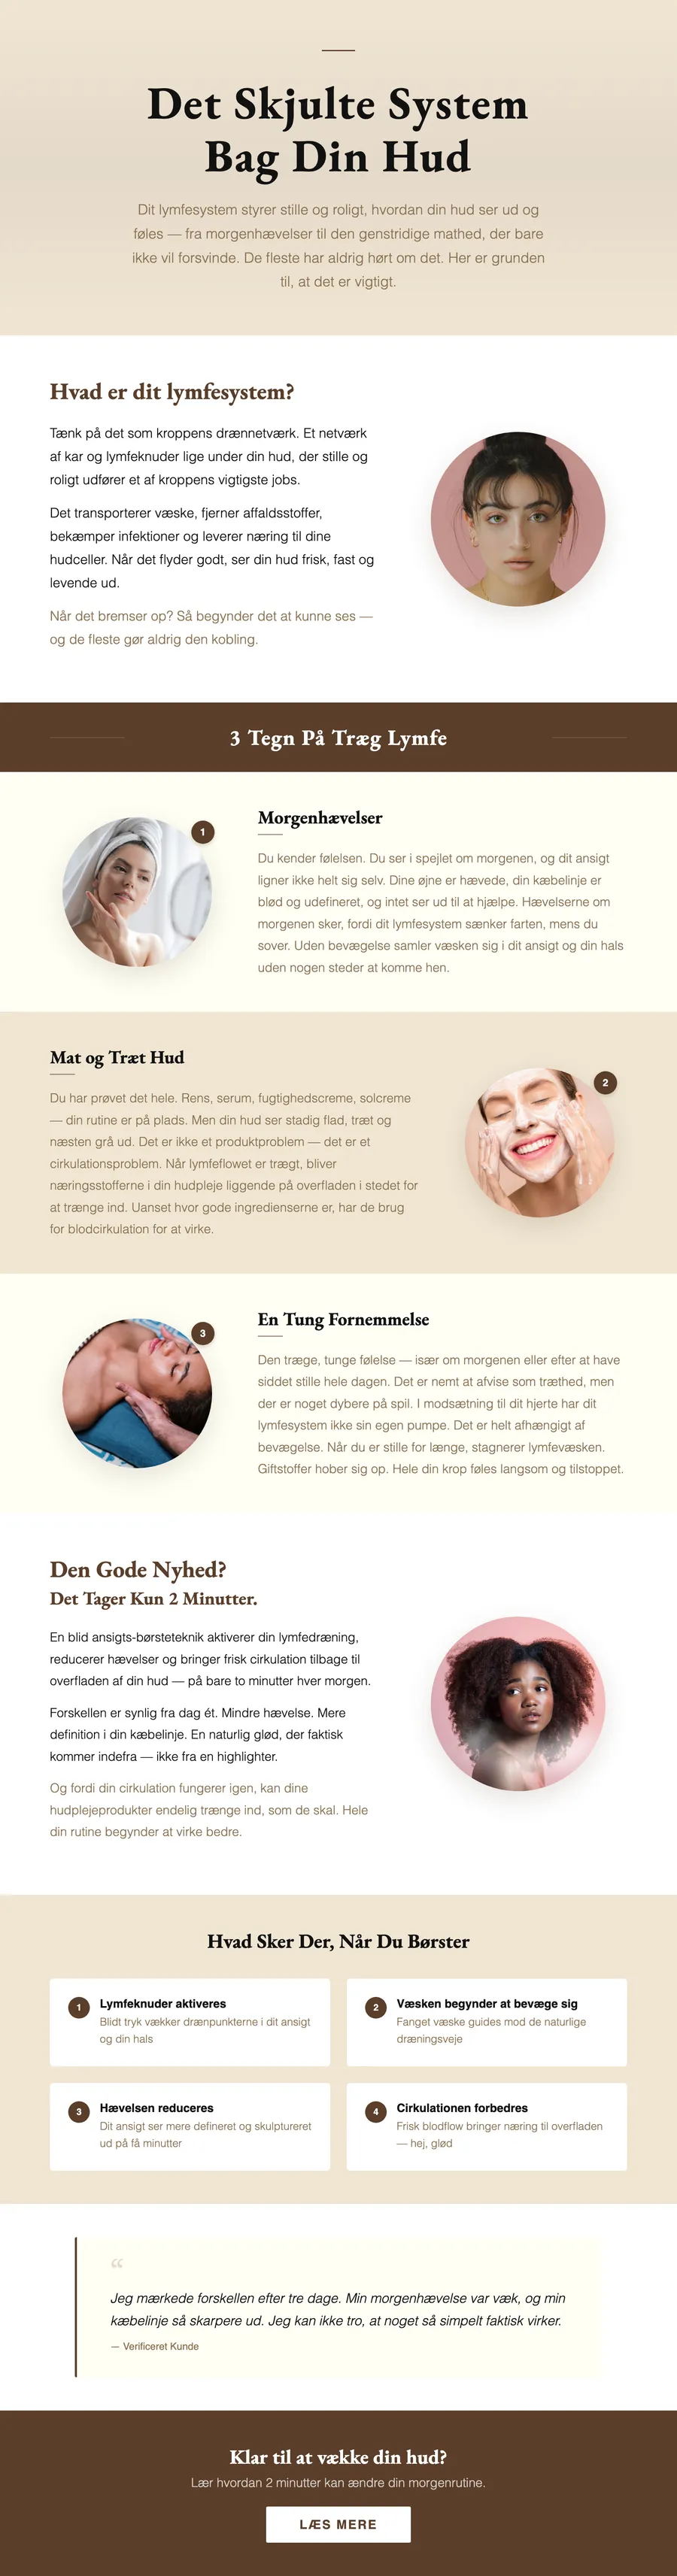
The lymphatic system, explained · Denmark · February 10 | 61.4% opened · 2.19% clicked | 8,147 |
|---|
Source: Monthly reports and campaign analytics for both accounts
Single sends. Sales earned the most and the education emails were read the most. Open rates are inflated by mail privacy features.